How do you view the extraction information?
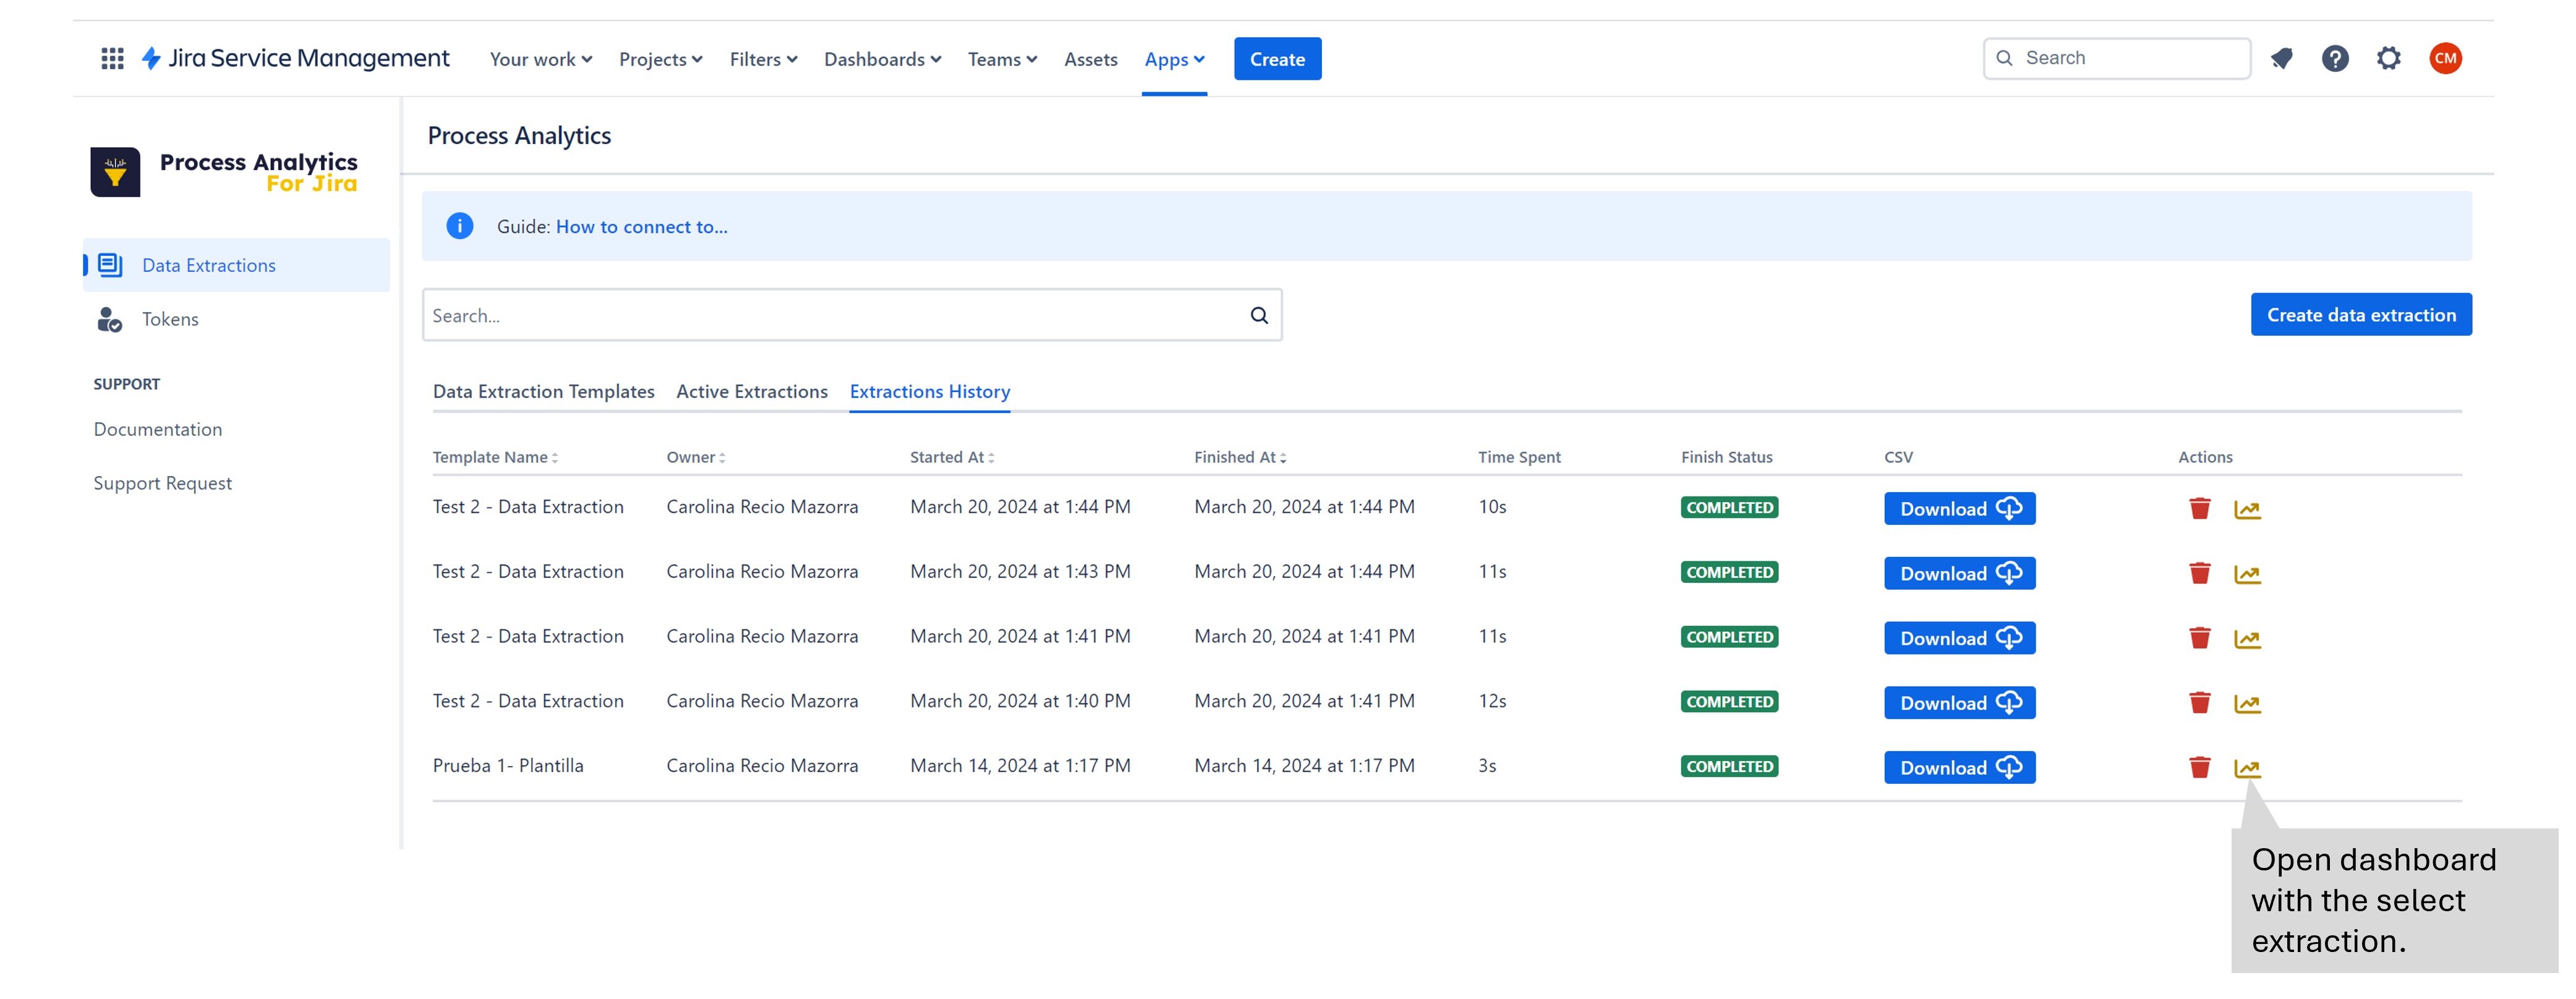
To view the extracted data from the JIRA instance, follow these steps:
Go to the Extractions History tab.
Click on the “View extraction history dashboard” action.
This dashboard provides essential information and allows you to analyze processes effectively. It helps you understand what is happening within the system.

What information is displayed?
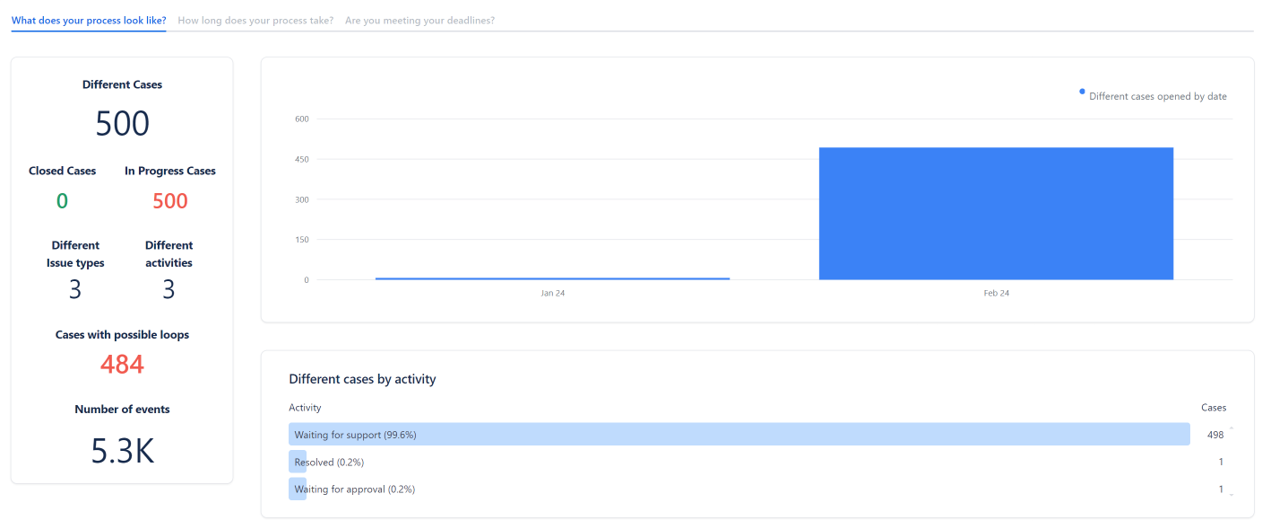
The following information is displayed on the dashboard, which consists of three tabs, each tab answering a specific question:
What does your process look like?
In this tab, the dashboard displays general information about the actual execution of your process.
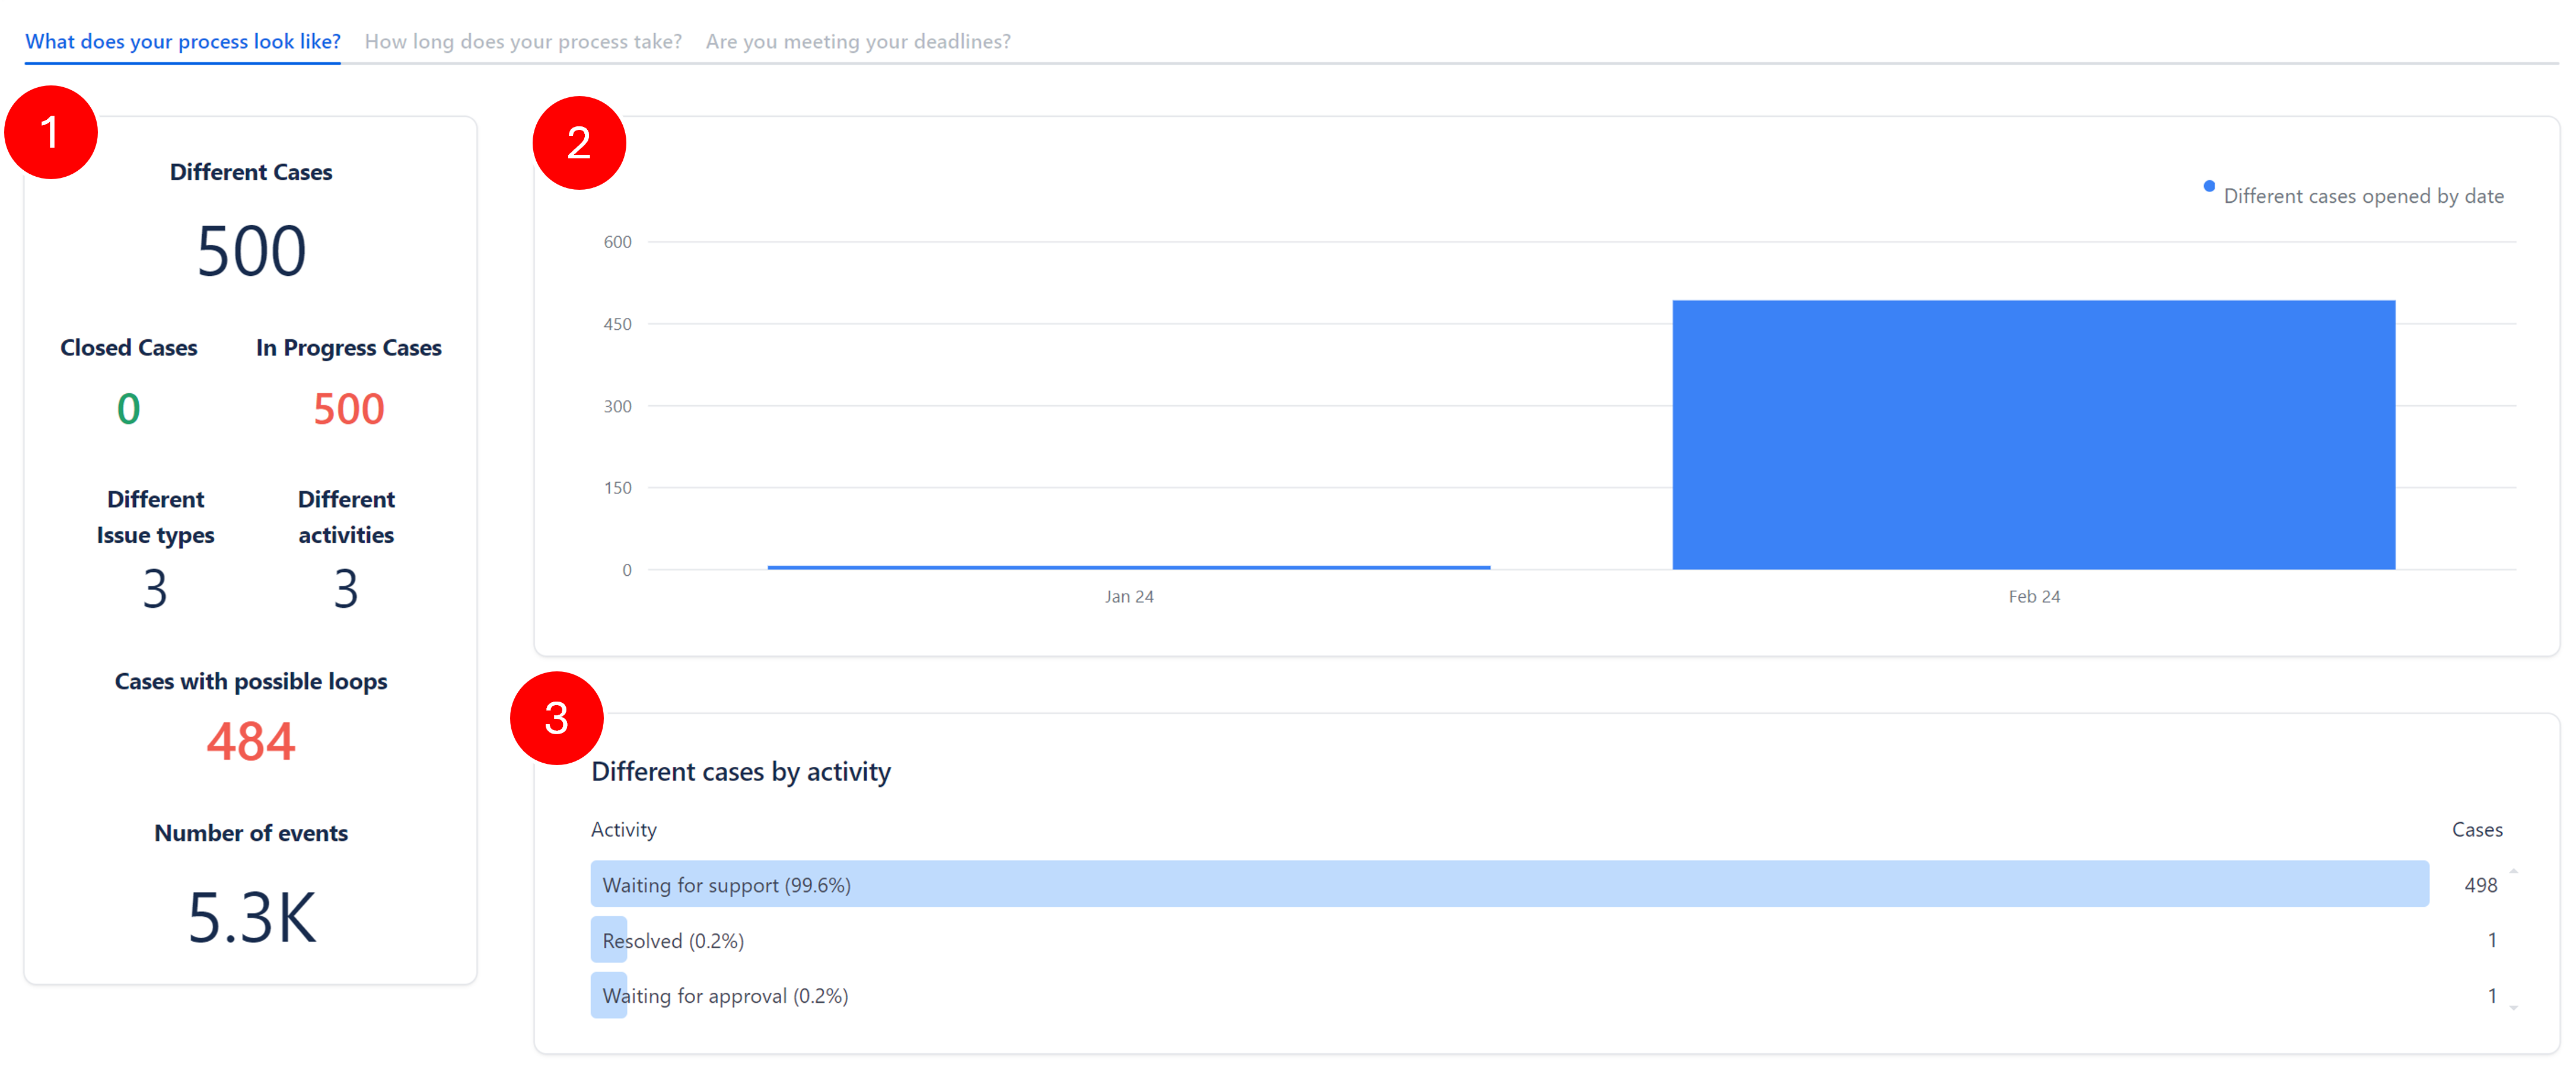
Section | Definition |
|---|---|
 | In this section, you can obtain more specific details regarding the extraction that was performed:
|
 |
|
 |
|
How long does your process take?
In this tab, you can obtain information about the process execution times.
This option is currently under construction and will be activated soon.
Are you meeting your deadlines?
This tab displays any deviations in process execution time.
This option is currently under construction and will be activated soon.
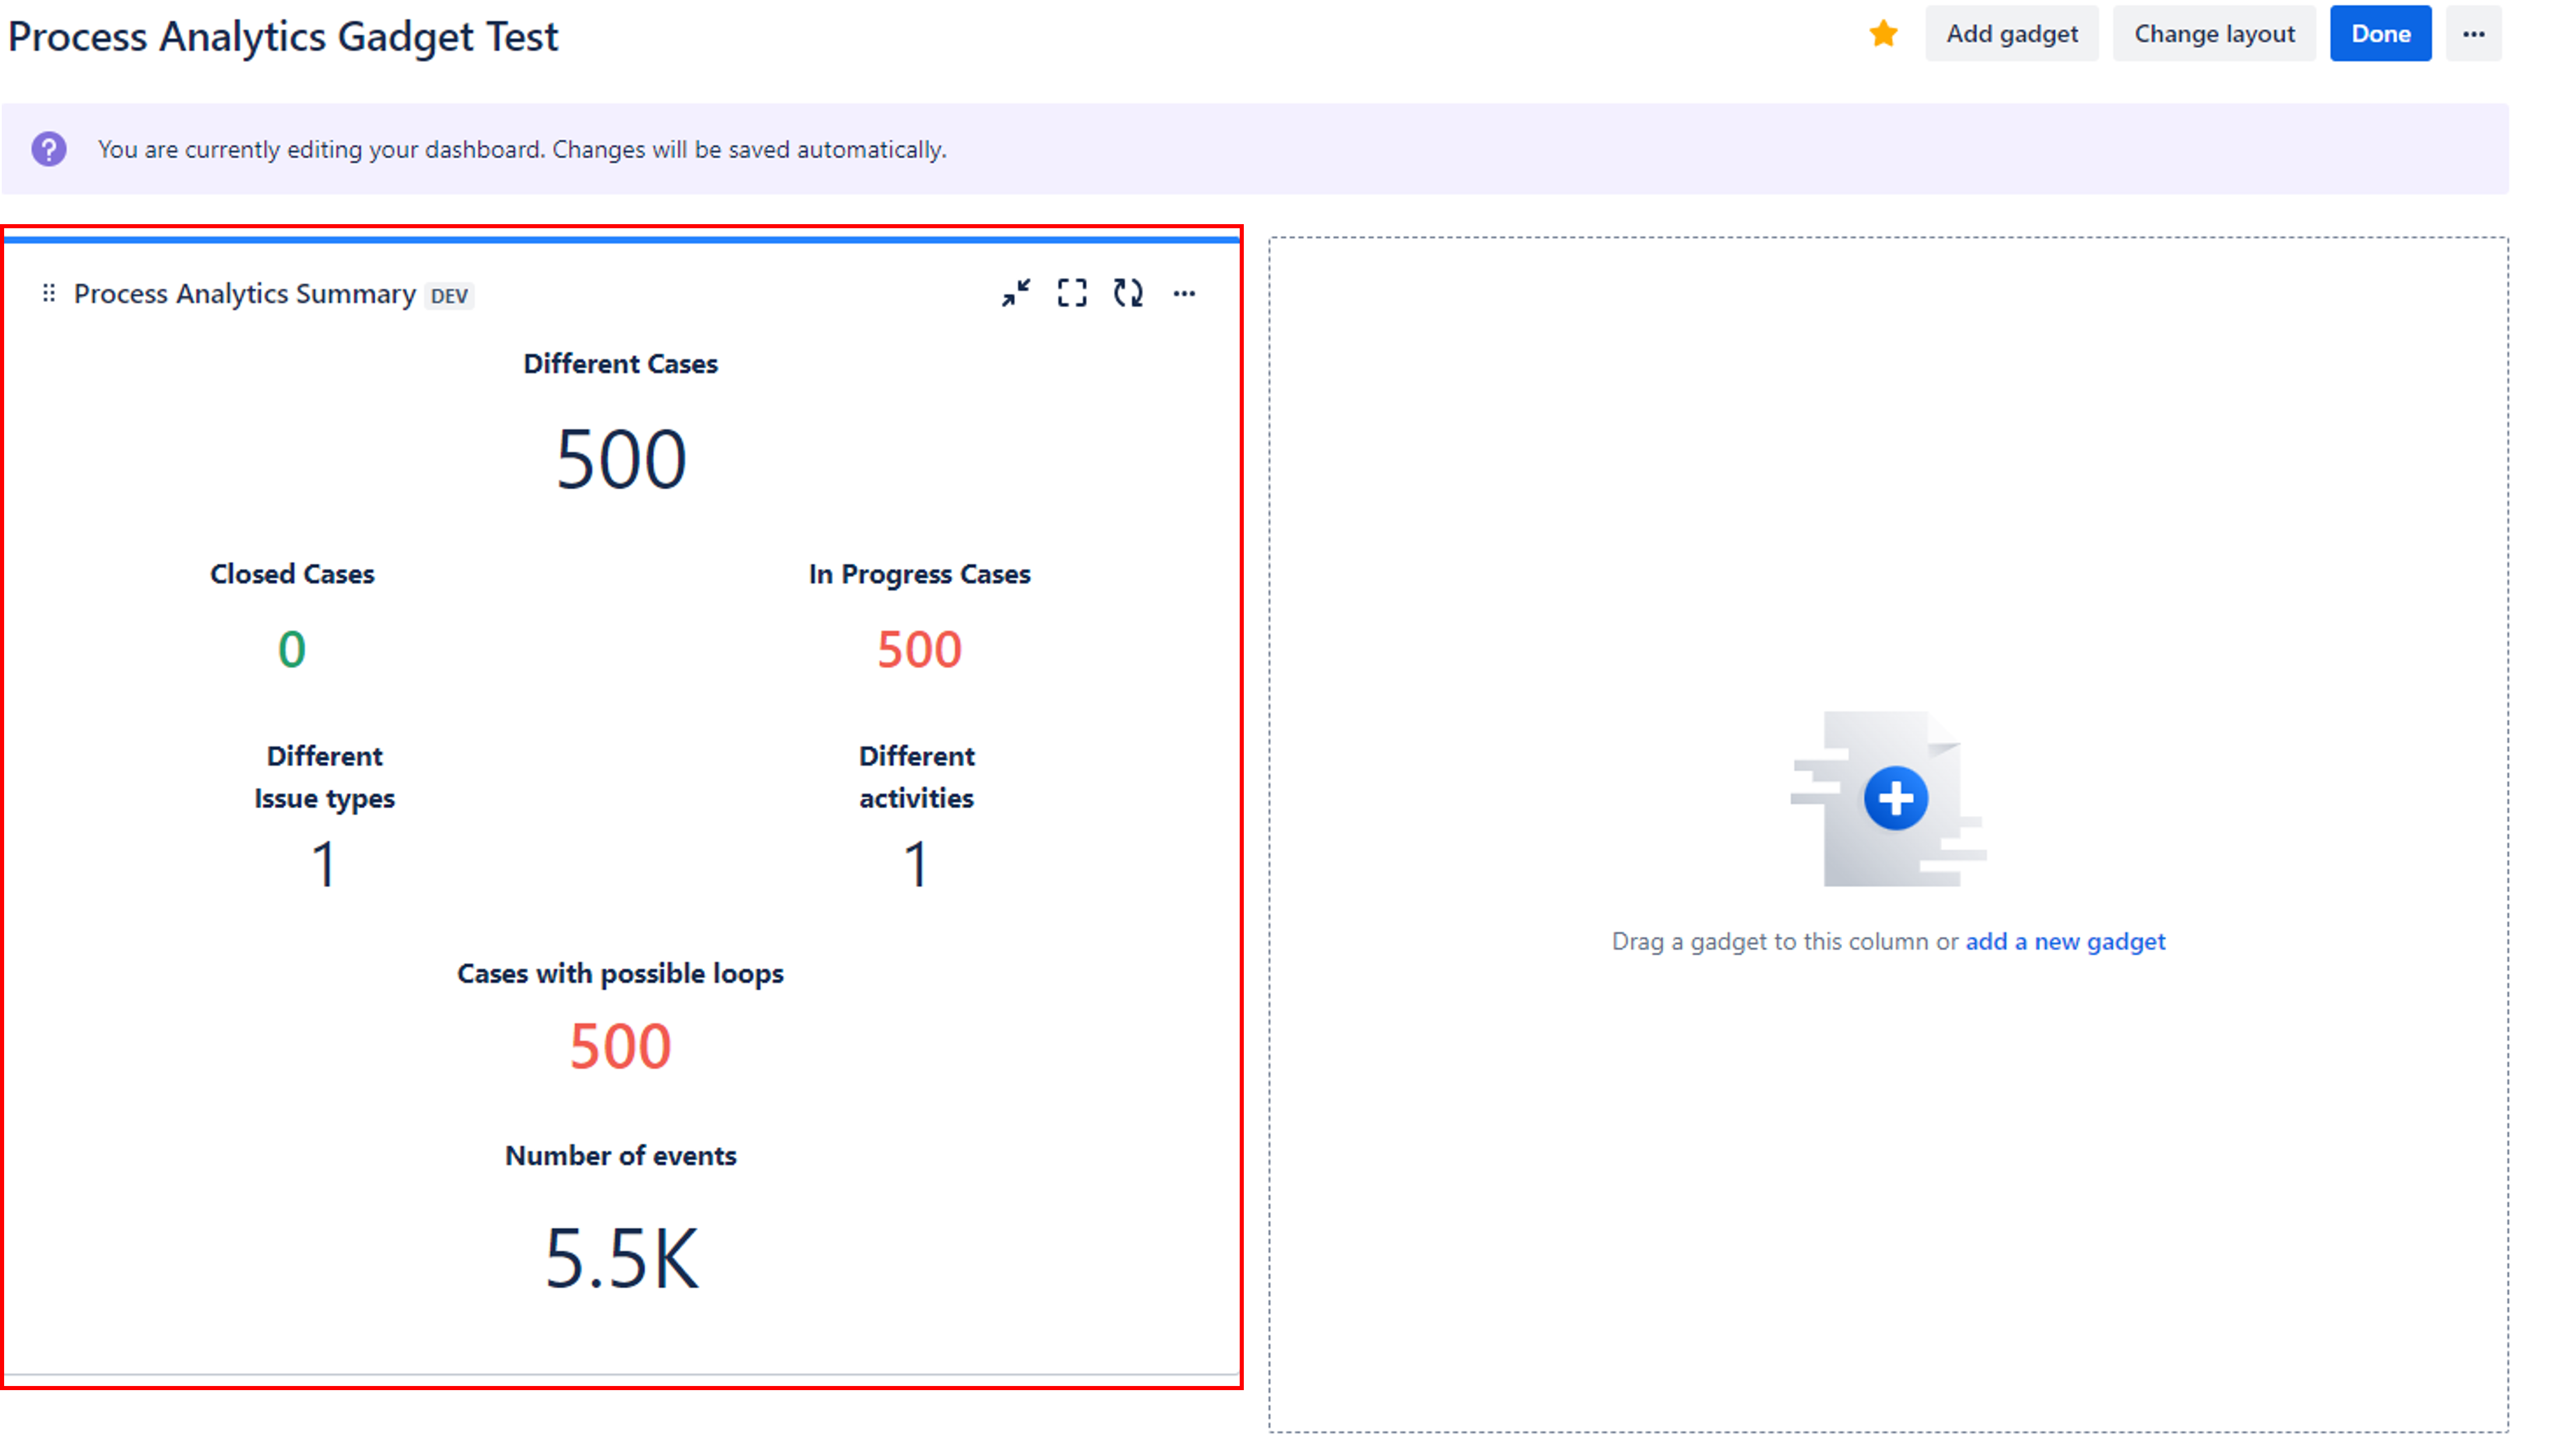
How do you include extraction information in JIRA Dashboard?
You can display extract information directly in the JIRA dashboard.
Once you have installed the Process Analytics app, you can easily add Process Analytics gadgets to your JIRA Dashboard.
Currently, the available gadgets are as follows:
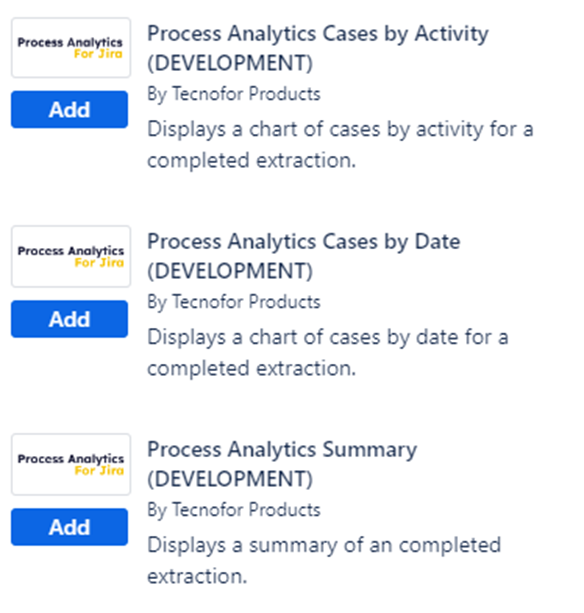
Below we show you the steps to include Process Analytics Gadget in Jira Dashboard:
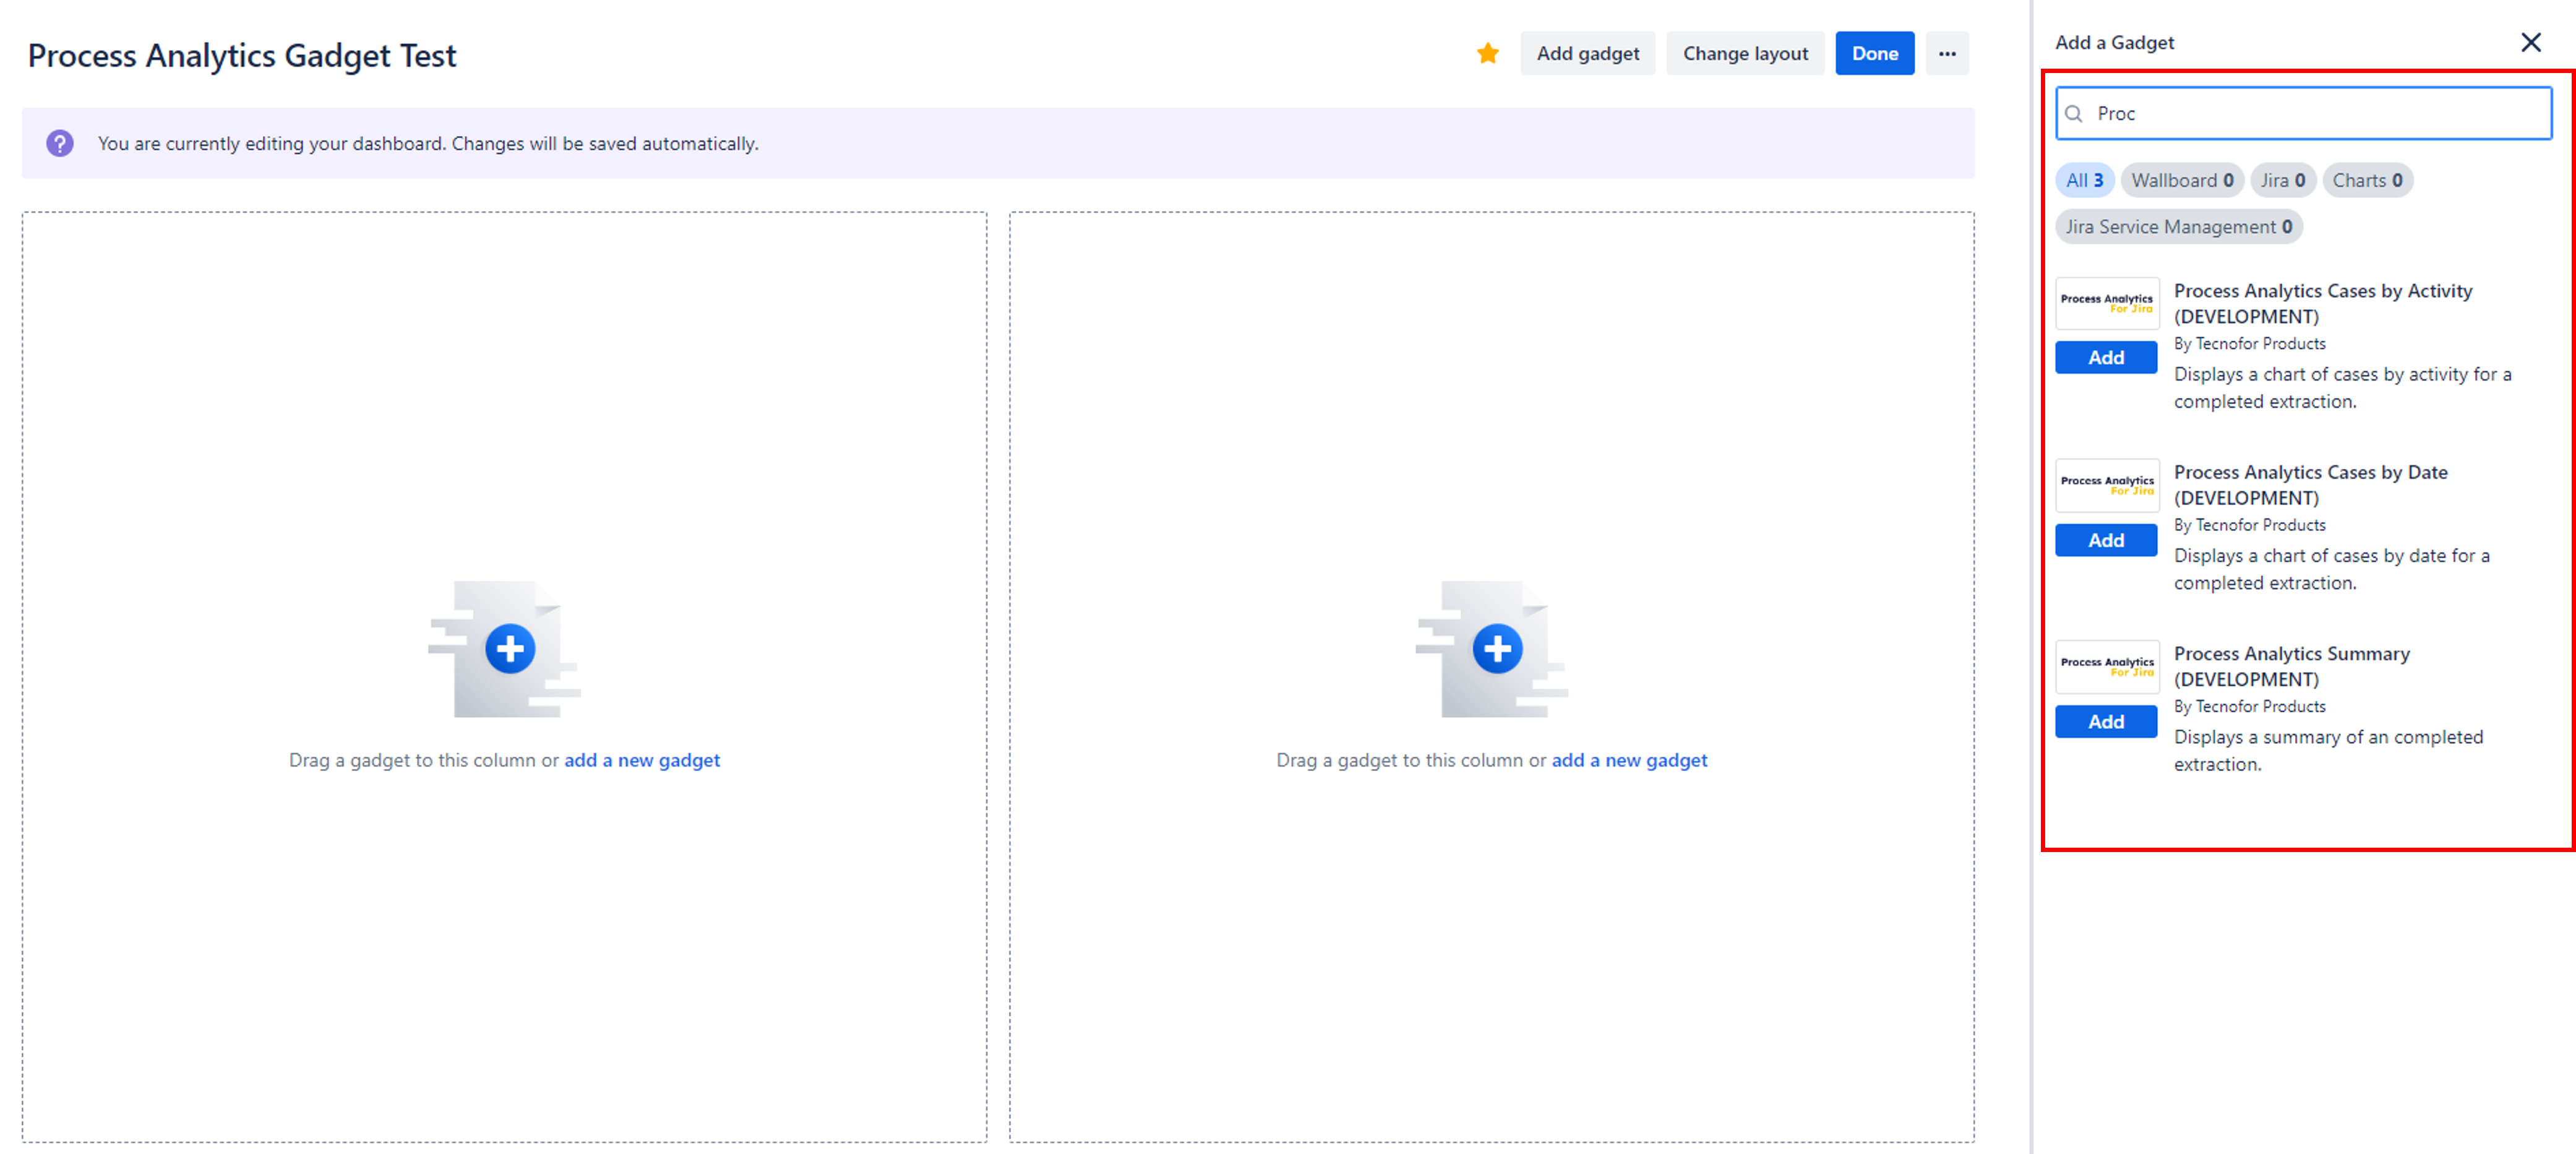
When creating or editing a Jira Dashboard, you can easily access the Process Analytics Gadgets by searching for the app name. The search results will show you all available gadgets.
Click the "Add" button to add the gadget to the Dashboard.
Once you add the gadget to the dashboard, you need to select the extraction from the list to display information.
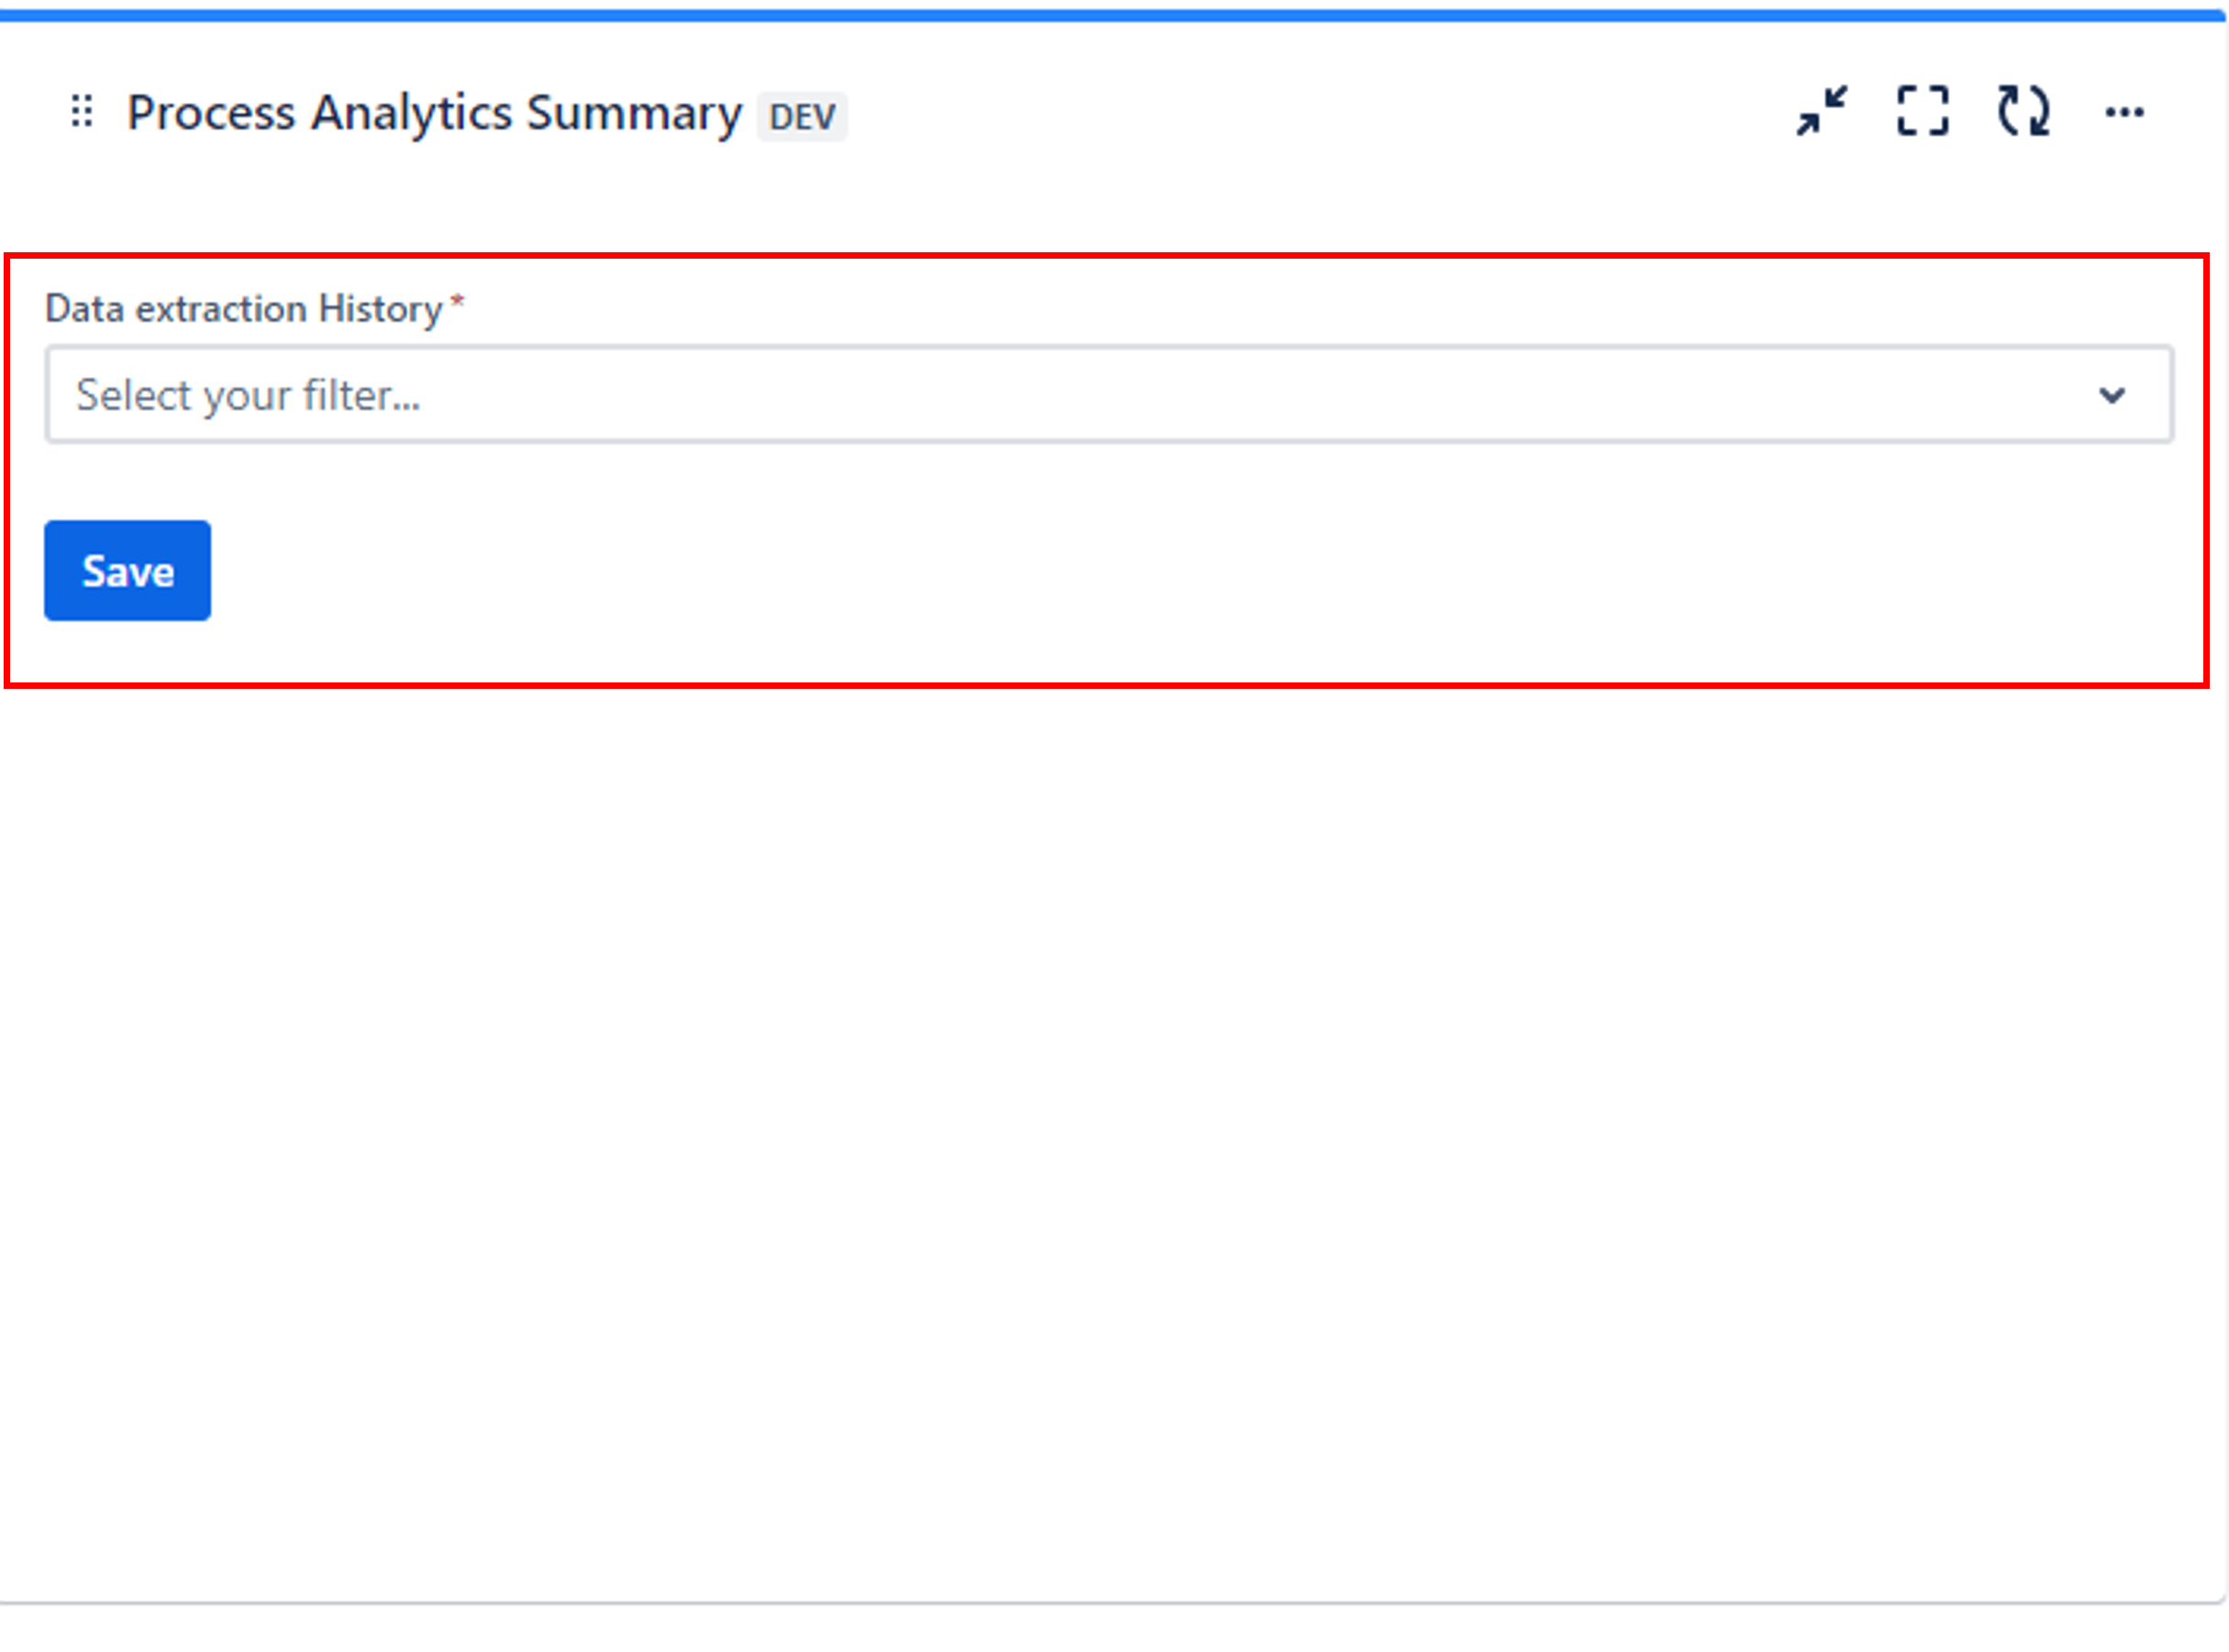
Refresh the gadget by pressing the “Save” button to view the selected extraction information.